Three published numbers, three different groups of people
The question has three official answers, and they are not interchangeable. The Bureau of Labor Statistics reports a median annual wage of $89,900 for farmers, ranchers, and other agricultural managers as of May 2025, which is what an employer pays someone doing that job. The U.S. Department of Agriculture reports a median farm household income of $102,748 for 2024, which is what a farming family takes in from every source combined. USDA also reports that the median income from farming itself was -$1,830 that year, which is what the farm business returned to the household.
Those are three different measurements: an employer wage, a household total, and a business result. Reading the first as "what farmers earn" overstates the case for the self-employed majority. Reading the third understates it for anyone who draws a paycheck.
What BLS pays farmers, ranchers, and agricultural managers
BLS files this occupation under SOC 11-9013 and builds its pay figures from the Occupational Employment and Wage Statistics survey, which asks employers what they pay rather than asking workers what they receive. For May 2025 the median was $89,900 a year, or $43.22 an hour.
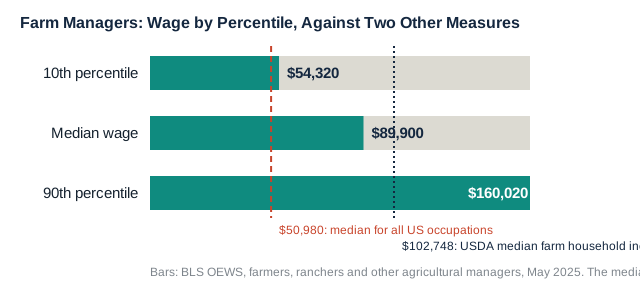
The spread around that midpoint is wide. The lowest-paid 10% earned less than $54,320, and the highest-paid 10% earned more than $160,020. Both are boundary figures: BLS reports that the bottom decile fell below the first number and that the top decile cleared the second, so neither is a ceiling or a floor for the occupation as a whole.
Two comparison points put the median in context. Other management occupations had a median of $106,770, and the median across all U.S. occupations was $50,980, which makes the typical figure here roughly 1.8 times the national one. The national salary statistics overview collects the comparison figures used across this site and traces each to its publisher. BLS counted about 788,700 people in this occupation in 2025.
Why that wage median covers a minority of the occupation
BLS lists self-employed workers as 67% of the people in this occupation. That share matters because the survey behind the $89,900 figure does not include them. The Occupational Employment and Wage Statistics program defines employees as part-time and full-time workers who are paid a wage or salary, and states plainly that it does not cover the self-employed, owners and partners in unincorporated firms, household workers, or unpaid family workers.
So the median is calculated from roughly the one-third of the occupation that works for somebody else. An operator who owns the farm and draws income from the business never enters that calculation, whatever the business returns.
The employment count on the same BLS page does include the self-employed, because it comes from a different program. The wage survey FAQ points to the Office of Employment Projections for national occupational employment estimates that include the self-employed. That is why a count of 788,700 and a median of $89,900 sit on one page without describing the same set of people.
Real estate agents are another commission-based occupation in this survey, where BLS says earnings may be irregular; the real estate agent pay breakdown treats the annual median as a smoothed average.
USDA counts households, not jobs
USDA's Economic Research Service measures farm households rather than jobs, and its 2024 figures describe a different picture. Median total household income for farm operator households was $102,748, against $83,730 for U.S. households generally. Median off-farm income was $86,900. Median income from farming was -$1,830, which means the typical farm household lost money on the farm operation that year while still finishing ahead overall.
USDA splits that population by farm type, and the spread between the groups is large. Households operating commercial farms, defined as $350,000 or more in gross cash farm income, reported median farm income of $174,933 and median total household income of $261,149. Intermediate farms reported median farm income of -$2,799 and total household income of $70,886. Residence farms reported median farm income of -$2,748 and total household income of $120,848.
The share with a profitable farm operation tracks the same split. In 2024, 84% of commercial farms had positive income from farming, compared with 42% of intermediate farms and 35% of residence farms. USDA counts roughly 1.8 million family farms.
Where that off-farm money comes from is not evenly spread. Of all off-farm income earned by farm operator households, 55% came from wages and salaries of household members, 22% from transfers such as Social Security, 9% from nonfarm businesses, and 15% from other sources including interest and dividends. Farm households also hold more wealth than the average U.S. household: the median farm household had $1.6 million in wealth in 2024, and households running commercial farms had $3.9 million at the median.
One more comparison gets at the same question from the business side. USDA defines farm business households as those that report farming as their primary occupation, plus commercial farms at $350,000 or more in gross cash farm income. Their median income in 2024 was $76,622, against $108,196 for U.S. households that report self-employment income. The two groups are not the same set of households, so the gap compares two medians rather than following the same families over time.
None of this contradicts the BLS wage figure. It measures a population the wage survey leaves out, which is the point of reading the two side by side.
Job outlook: a projected 3% decline
BLS projects employment of farmers, ranchers, and other agricultural managers to fall 3% between 2025 and 2035, from 788,700 to 762,200, a decrease of 26,500. It still expects about 70,800 openings a year, and says all of them come from replacement: workers transferring to other occupations or leaving the labor force, such as to retire.
BLS attributes the decline to consolidation. Increased efficiencies in crop production have produced fewer but larger farms, and larger farms invest more in productivity-enhancing technology. The agency also notes that many small farms operate on slim margins and are vulnerable to poor market conditions, and that operators of small farms will likely keep exiting the business over the decade.
These are projections about an occupation and a sector, not a forecast about any individual. BLS data describes national averages, and the figures above are a description of where the market has been and where employment is headed in aggregate.