Key Takeaways
Thirteen headline figures from this page, each traceable to the government agency or association below that published it first.
- $69,770: the national mean annual wage across the roughly 830 occupations tracked by BLS, May 2025.
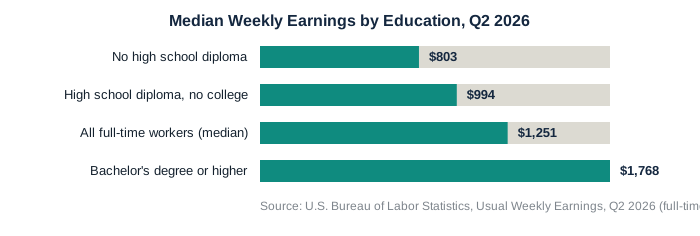
- $1,251: median weekly earnings for the nation's 120.9 million full-time wage and salary workers, per BLS, Q2 2026.
- Women's median weekly earnings were 82.0% of men's in the second quarter of 2026 ($1,131 versus $1,380), per BLS, Q2 2026.
- The female-to-male earnings ratio for full-time, year-round workers fell to 80.9% in 2024, the second straight annual decline, per the U.S. Census Bureau, Sept. 2025.
- $83,730: median U.S. household income in 2024, not statistically different from 2023's $82,690, per the U.S. Census Bureau, Sept. 2025.
- Workers with a bachelor's degree or higher had median weekly earnings of $1,768 in Q2 2026, more than double the $803 for workers without a high school diploma, per BLS, Q2 2026.
- Private-industry wages and salaries rose 3.1% over the year ending June 2026, but fell 0.4% once adjusted for inflation, per BLS Employment Cost Index, Aug. 2026.
- The Atlanta Fed's Wage Growth Tracker put nominal wage growth at 4.1% in August 2026, with workers who switched jobs gaining 5.0% versus 3.6% for those who stayed, per the Federal Reserve Bank of Atlanta, Sept. 2026.
- Union members had 2025 median weekly earnings of $1,404, versus $1,174 for nonunion workers, whose pay BLS puts at 84% of the union figure, per BLS Union Members, Feb. 2026.
- The federal minimum wage has been $7.25 an hour since July 24, 2009, per the U.S. Department of Labor.
- Only 1.0% of hourly-paid workers earned at or below that federal minimum in 2024 (1.3% of women, 0.8% of men); the rate was highest in leisure and hospitality, at 5.6%, per BLS Report 1115, June 2025.
- Employers spent $49.46 an hour per civilian worker on total compensation in June 2026, with benefits making up $15.61 of that, per BLS Employer Costs for Employee Compensation, Sept. 2026.
- Class of 2025 bachelor's degree graduates earned an average starting salary of $67,983, up 3.5% from the Class of 2024, per NACE, Sept. 2026.
How much does the typical American worker earn in 2026?
The most common occupation pays far less than the highest-paid one, and the gap between them runs into the hundreds of thousands of dollars a year.
- Home health and personal care aides make up the single largest occupation in the country, employing 4.3 million people, per BLS, May 2025.
- Pediatric surgeons are the highest-paid occupation BLS tracks nationally, with a mean annual wage of $502,050, followed by cardiologists at $454,940, per BLS, May 2025. This site has more detail on one physician specialty, psychiatrist pay.
- Nurse anesthetists, at $248,320, are the highest-paid occupation in the country that isn't a physician, surgeon, or dentist role, per BLS, May 2025.
- Of the 10 largest occupations in the U.S., only registered nurses ($101,420) and general and operations managers ($134,940) pay above the $69,770 national average wage. The other eight range from $32,150 for fast food and counter workers to $46,590 for customer service representatives, per BLS, May 2025.
- Government jobs account for 14.6% of total U.S. employment, per BLS, May 2025.
Does a college degree still change how much you're paid?
Yes, and the gap widens the further up the pay scale you look.
- Among hourly-paid workers 25 and older, 1.5% of those without a high school diploma earned at or below the federal minimum wage in 2024, versus about 1.0% for high school graduates, workers with some college, and bachelor's degree holders, per BLS Report 1115, June 2025.
- At the top of the pay scale, the highest-earning 10% of full-time workers with an advanced degree made at least $5,363 a week for men and $3,676 a week for women in Q2 2026, per BLS, Q2 2026.
- New bachelor's graduates in computer and information sciences had the highest average starting salary among the Class of 2025, at $91,517, up 2.9% from the year before. For a look at pay without that degree at all, see the site's no-degree occupation ranking. The computer-sciences figure is per NACE, Sept. 2026.
- Class of 2026 master's degree graduates in computer sciences are projected to average $94,212, a 10.9% jump from last year's $84,960, per NACE, Feb. 2026.
Is the pay gap between men and women closing or widening?
By the Census Bureau's own year-over-year comparison, it widened in 2024, the second year in a row that happened.
- Full-time, year-round median earnings rose 3.7% for men between 2023 and 2024, with no statistically significant change for women, per the U.S. Census Bureau, Sept. 2025.
- The gender pay gap widens with age: women 16 to 24 earned 91.1% of what men the same age earned in Q2 2026, while women 55 and older earned only 78.5% of their male peers' pay, per BLS, Q2 2026.
- In management and professional occupations, the best-paid major job category, full-time men earned a median $1,928 a week in Q2 2026, compared with $1,476 for women, per BLS, Q2 2026.
- Service occupations were the lowest-paid major job category: $920 a week for men and $730 for women in Q2 2026, per BLS, Q2 2026.
How does pay differ by race and ethnicity?
BLS's weekly-earnings survey shows the gap is widest between Hispanic and Asian workers, and it persists within the same gender.
- Median weekly earnings by race and ethnicity in Q2 2026: Asian workers $1,713, White workers $1,268, Black workers $1,029, Hispanic workers $997, per BLS, Q2 2026.
- Among men, Black workers' median weekly earnings ($1,089) were 77.8% of White men's ($1,400); Hispanic men's earnings ($1,080) were 77.1% of White men's, in Q2 2026, per BLS, Q2 2026.
- Between 2023 and 2024, median household income rose 5.5% for Hispanic households and 5.1% for Asian households, while it fell 3.3% for Black households, per the U.S. Census Bureau, Sept. 2025.
- Black workers had the highest union membership rate of any racial group in 2025, at 11.4%, compared with 9.9% for White workers, 8.9% for Hispanic workers, and 8.7% for Asian workers, per BLS Union Members, Feb. 2026.
Which industries and occupations pay the most, and which pay the least?
Healthcare pays among the most of any major occupation group BLS tracks, well ahead of construction and education, though not the single highest.
- Healthcare practitioners and technical occupations, one of the higher-paying major groups BLS tracks, had a mean wage of $108,700 across 9.8 million jobs, per BLS, May 2025.
- Registered nurses, the largest healthcare occupation at 3.4 million jobs, had a mean wage of $101,420 nationally, ranging from about $77,000 in Alabama and South Dakota to $150,280 in California, per BLS, May 2025.
- Educational instruction and library occupations employed 9.1 million people at a mean wage of $67,540. Elementary school teachers averaged $72,650, ranging from $52,300 in Mississippi to $97,970 in Washington state, per BLS, May 2025.
- Construction and extraction occupations employed 6.4 million people, 4.1% of the national workforce, at a mean wage of $65,360, below the $69,770 national average, per BLS, May 2025.
Are wages actually keeping up with inflation?
Not for private-industry workers as a group, once the numbers are adjusted for the Consumer Price Index.
- Real average hourly earnings for all U.S. employees fell 0.3% between August 2025 and August 2026, even as nominal average hourly earnings rose, once the Consumer Price Index is factored in, per BLS Real Earnings, Sept. 2026.
- Real average weekly earnings still rose 0.3% over that same year, because the average workweek lengthened 0.6%, per BLS Real Earnings, Sept. 2026.
- Compensation costs for state and local government workers rose 3.6% over the year ending June 2026, faster than the 3.4% gain for civilian workers overall, per BLS Employment Cost Index, Aug. 2026.
- Household income at the 90th percentile rose 4.2% between 2023 and 2024, while income at the 10th and 50th percentiles showed no statistically significant change, per the U.S. Census Bureau, Sept. 2025.
How much do employers spend on top of the paycheck?
Benefits account for roughly three to four of every ten dollars an employer spends on compensation, and the share is higher in government jobs than in private industry.
- For full-time private-industry workers, total compensation averaged $54.00 an hour in June 2026, versus $25.20 an hour for part-time workers, per BLS Employer Costs for Employee Compensation, Sept. 2026.
- Benefits made up 30.0% of total compensation costs for private-industry workers in June 2026, versus 38.8% for state and local government workers, per BLS, Sept. 2026.
- Full-time private-industry workers received $4.40 an hour in paid-leave benefits and $3.76 an hour in legally required benefits (Social Security, Medicare, unemployment insurance) as of June 2026, per BLS, Sept. 2026.
- Part-time private-industry workers received just $0.90 an hour in paid-leave benefits, a fifth of the full-time figure, per BLS, Sept. 2026.
Does union membership still come with a pay premium?
Yes, and the premium BLS reports has held for decades even as the union membership rate itself has fallen.
- The U.S. union membership rate was 10.0% in 2025, down from 20.1% when comparable records began in 1983, per BLS Union Members, Feb. 2026.
- Public-sector workers were more than five times as likely to belong to a union as private-sector workers in 2025: 32.9% versus 5.9%, per BLS, Feb. 2026.
- Local government had the highest union membership rate of any sector, at 37.8% in 2025, per BLS, Feb. 2026.
- Education, training, and library occupations had the highest unionization rate of any occupational group, at 32.5%, followed by protective service occupations at 31.3%, per BLS, Feb. 2026.
Who actually earns the federal minimum wage?
A small and specific slice of the workforce: mostly young, mostly part-time, and concentrated in food service.
- Thirty states plus Washington, D.C. had minimum wages above the $7.25 federal floor as of 2024, per BLS Report 1115, June 2025.
- Workers under 25 made up one-fifth of all hourly-paid workers in 2024 but 43% of those earning at or below the federal minimum wage, per BLS, June 2025.
- Among teenagers 16 to 19 paid by the hour, 2.6% earned at or below the federal minimum in 2024, nearly four times the 0.7% rate for workers 25 and older, per BLS, June 2025.
- Part-time hourly workers were four times as likely as full-time workers to earn at or below the federal minimum in 2024: 2.4% versus 0.6%, per BLS, June 2025.
- Nearly three-quarters of all workers earning the federal minimum wage or less in 2024 worked in service occupations, mostly food preparation and serving, per BLS, June 2025.
- Louisiana and South Carolina had the highest share of hourly workers earning at or below the federal minimum in 2024, both at or just above 2.0%, per BLS, June 2025.
What are new college graduates earning in 2026?
Starting pay keeps climbing, but the size of the increase varies sharply by major and by year.
- The Class of 2024's final average starting salary, $65,677, was up just 2.2% from the Class of 2023, after two much larger increases: 7.1% for the Class of 2023 and 7.4% for the Class of 2022, per NACE, Aug. 2025.
- Class of 2026 bachelor's degree salary projections range from a 1.7% expected decline for social sciences majors to a 6.9% increase for computer sciences majors, per NACE, Jan. 2026.
- Within engineering, petroleum engineering has the highest projected starting salary among the Class of 2026, at $100,750, per NACE, Jan. 2026.
- At the master's degree level, Class of 2025 engineering graduates saw projected salaries climb 12.5% to $94,086, and business graduates climbed 3.1% to $77,632, both following declines the year before, per NACE, Feb. 2025.
- The average hourly wage for bachelor's-level interns reached $23.04 in 2024, the tenth straight year of increases, though it was down 1.1% after adjusting for inflation since 2015, per NACE, Mar. 2025.
How confident are workers about negotiating their pay?
Most professionals say they feel ready to negotiate, and most hiring managers say they're bracing for it.
- 88% of professionals say they feel confident negotiating salary when given a job offer, per Robert Half 2026 Salary Guide.
- 74% of hiring managers say they worry about keeping up with candidates' compensation expectations through 2026, per Robert Half, 2026.
- 53% of workers say they would switch jobs for better financial incentives like bonuses or stock options, and 66% of professionals say they would come into the office five days a week for higher pay, per Robert Half, 2026.
- Half of hiring managers predict that adding new benefits and perks will be an effective strategy for recruiting skilled candidates in 2026, per Robert Half, 2026.
Methodology and how to cite this page
Every figure above links to the original release, report, or press page from the agency or association that produced it: the U.S. Bureau of Labor Statistics, the U.S. Census Bureau, the Federal Reserve Bank of Atlanta, the National Association of Colleges and Employers, and Robert Half. None of it is pulled from a secondary statistics roundup, and each source URL was checked directly before publication. One gap worth flagging: Robert Half's page describes surveying 2,250 business leaders but doesn't break out which specific figures came from that group versus a separate worker-facing survey, so those numbers are presented here as Robert Half itself presents them, without that added layer of detail. Last verified: September 13, 2026.
Cite this
WageLark Editorial, “US Salary Statistics 2026: Sourced, Not Recycled,” WageLark, published September 13, 2026, https://wagelark.com/salary-statistics-2026/.