The $62,780 median, and why "ironworker" is really two jobs
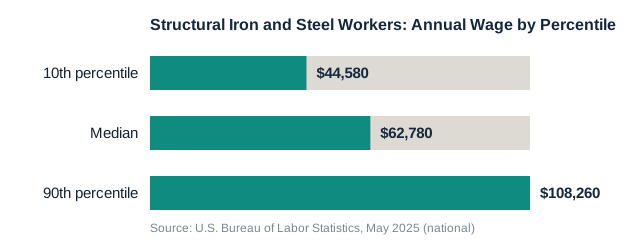
Per BLS, the median annual wage for structural iron and steel workers, the trade most people picture when they hear "ironworker," the crews who bolt and weld together the steel skeletons of buildings, bridges, and towers, was $62,780 in May 2025. The bottom 10% of earners made less than $44,580, while the top 10% cleared $108,260, a spread of roughly $63,680 between the extremes. That $62,780 median sits within about $1,000 of what BLS reports for electricians and plumbers, two other high school diploma-entry trades this site covers, and its $108,260 top-decile figure lands almost exactly on top of theirs too, a pattern detailed further down this page.
BLS's Occupational Outlook Handbook page titled "Ironworkers" actually covers a second, separate occupation with its own six-digit SOC code: reinforcing iron and rebar workers, who install the steel reinforcing bars inside concrete before it's poured, rather than erecting structural steel frames. That trade earned less at every point BLS measures for May 2025: a $58,970 median, $3,810 below the structural figure, with a $43,310 to $104,540 spread between its 10th and 90th percentiles. The two trades share entry requirements and many of the same apprenticeship programs, but BLS tracks them as distinct occupations in its pay tables, not interchangeable titles for the same job.
Same page, opposite 10-year outlooks
BLS's employment projections for this page split even further than pay does. Structural iron and steel workers are projected to grow 3% from 2025 to 2035, in line with the roughly 3% growth BLS projects across all U.S. occupations combined. Reinforcing iron and rebar workers are projected to shrink 5% over the same period, one of relatively few occupations on this site with a declining outlook rather than flat or growing employment. Blended together, those two trends average out to the 1% "slower than average" figure BLS publishes as the combined "Ironworkers" headline number, a single stat that obscures a real divergence between the two trades it covers.
| Structural iron and steel workers | Reinforcing iron and rebar workers | |
|---|---|---|
| Median annual wage | $62,780 | $58,970 |
| 10th percentile | $44,580 | $43,310 |
| 90th percentile | $108,260 | $104,540 |
| Job outlook, 2025-35 | +3% | -5% |
| Top-paying industry (May 2025) | Heavy/civil engineering construction, $73,470 | Nonresidential building construction, $64,010 |
BLS does not explain the split on this page. One plausible read, drawn only from the industry wage tables BLS does publish: structural steel work leans more on heavy and civil engineering construction, at $73,470 a year the highest-paying industry for that trade, a category that includes bridges, highways, and other infrastructure with a large public-funding component. Reinforcing work is more tied to nonresidential building construction specifically, at $64,010 its own top-paying industry, which may track more closely with private commercial building cycles. That's offered as a plausible explanation grounded in that industry breakdown, not a claim BLS makes about the cause.
How to become an ironworker
Per BLS, ironworkers typically need only a high school diploma or equivalent to enter the trade, the same nominal bar as electricians, welders, and several other trades this site covers. Most learn through a 3- or 4-year apprenticeship, sponsored by unions and contractor associations, and BLS notes that nearly all of these programs teach both reinforcing and structural ironworking rather than specializing apprentices into just one track from the start. Each year of the program requires at least 144 hours of related technical instruction plus 2,000 hours of paid on-the-job training, per BLS, putting a full apprenticeship at somewhere between 432 and 576 classroom hours and 6,000 to 8,000 paid field hours depending on length. Apprentices typically start around half of what a journey-level ironworker earns and receive raises as they take on more of the job; completing the program makes someone a journey-level worker able to perform tasks without direct supervision.
BLS also flags a scheduling difference between the two trades worth knowing before choosing either path: structural ironworkers, who often work at significant heights, don't work in wet, icy, or extremely windy conditions, while reinforcing ironworkers, who work closer to ground level tying rebar, may still be limited by precipitation but face fewer weather-driven stoppages tied to height and wind. Most ironworkers of either type work full time, per BLS.
How ironworker pay compares with other no-degree trades
Against other high school diploma-entry trades this site has covered, structural ironworker pay lands close to the middle of the pack at the median but converges sharply at the top end. Electricians have a slightly higher median, $63,190 versus $62,780 for structural ironworkers, and their top decile, $108,510, sits within $250 of the ironworker figure above. Plumbers, pipefitters, and steamfitters run close behind at a $63,800 median with a $108,420 top decile, again within a few hundred dollars of both trades. Three separate BLS occupations, three different training paths and licensing structures, and all three converge on roughly $108,000 to $109,000 for their highest-paid 10%, a pattern BLS does not call out but that its own percentile tables show clearly side by side.
Welders, cutters, solderers, and brazers trail noticeably behind at every point BLS measures, a $51,000 median with a $75,850 top decile, roughly $32,000 below the structural ironworker ceiling despite a similar high school diploma entry bar and comparable use of cutting and joining equipment on the job. At the other extreme, electrical power-line installers and repairers, commonly called linemen, post a $92,560 median well above any of the trades here, reflecting the additional CDL and specialized high-voltage training that role typically requires on top of the same nominal high school diploma bar. BLS does not weigh how much of these gaps trace to licensing requirements, physical risk, or regional demand for each trade; the comparison describes what BLS's own tables report side by side, not a claim about which path suits a given reader.