LPN salary vs RN: the BLS numbers side by side
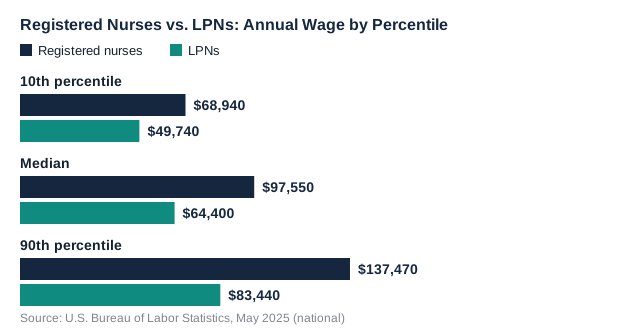
The Bureau of Labor Statistics reports a median annual wage of $97,550 for registered nurses (RNs) and $64,400 for licensed practical and licensed vocational nurses (LPNs) in May 2025. That is a gap of $33,150 a year, or about 51% more for the RN. By the hour the medians are $46.90 and $30.96. For context, BLS gives $50,980 as the median for all U.S. occupations, so the RN median is about 1.9 times the national middle and the LPN median about 1.3 times.
| Measure, May 2025 | Registered nurses | LPNs | RN minus LPN |
|---|---|---|---|
| Median hourly wage | $46.90 | $30.96 | $15.94 |
| 10th percentile (annual) | $68,940 | $49,740 | $19,200 |
| Median (annual) | $97,550 | $64,400 | $33,150 |
| 90th percentile (annual) | $137,470 | $83,440 | $54,030 |
| Jobs, 2025 | 3,465,400 | 666,900 | 2,798,500 |
The gap also changes along the pay scale. It is $19,200 at the 10th percentile, $33,150 at the median and $54,030 at the 90th percentile, so the better-paid RNs pull further away from the LPN scale. BLS's job counts work out to about 5.2 RN jobs for every LPN job.
Same workplace, different gap
The national median hides where each nurse works. BLS lists median wages for some of the top industries for each job, and three of them appear for both RNs and LPNs. Putting them next to each other shows that the RN advantage differs by setting.
| Where they work (median annual wage) | Registered nurses | LPNs | RN minus LPN | RN ÷ LPN |
|---|---|---|---|---|
| Government, excluding state and local education and hospitals | $110,780 | $68,970 | $41,810 | 1.61 |
| Hospitals; state, local, and private | $100,220 | $61,160 | $39,060 | 1.64 |
| Nursing and residential care facilities | $84,300 | $68,020 | $16,280 | 1.24 |
In government and in hospitals the RN median is about 1.6 times the LPN median. In nursing and residential care facilities it is about 1.24 times, a gap of $16,280, which is under half of the national $33,150. LPNs earned $68,020 in those facilities, $3,620 above the LPN national median, while RNs earned $84,300, $13,250 below the RN national median. For LPNs, then, a nursing care facility pays above the national middle, and for RNs it pays below it.
BLS lists other industries for each job that do not pair up. RNs are shown in ambulatory healthcare services ($91,230) and educational services ($78,620), and LPNs in home healthcare services ($63,580) and offices of physicians ($59,520). Those rows are not matched on purpose: BLS names broader and narrower industry groups for the two jobs, so subtracting them would compare different things. BLS says these are "some of the top industries" for each job, not every industry.
Where RN and LPN pay ranges meet
Medians compare the middle of two groups, but the ranges touch. The lowest-paid tenth of RNs earned less than $68,940, which is $4,540 above the LPN median of $64,400. In the other direction, the highest-paid tenth of LPNs earned more than $83,440, which is $14,110 below the RN median of $97,550. So the RN median is above the LPN 90th-percentile wage, and the RN 10th-percentile wage is above the LPN median. Even so, the LPN 90th-percentile wage sits above the RN 10th-percentile wage, which means some LPNs earn more than some RNs.
One detail shows how close the scales sit in places. The median LPN in government earned $68,970, which is $30 more than the $68,940 line under which the lowest-paid tenth of all RNs fall. The spread is also different. RN pay runs $68,530 from the 10th to the 90th percentile, about twice the $33,700 spread for LPNs. This article uses only national figures, with no split by state, shift or years of experience, so a particular nurse's pay can sit well above or below them.
Schooling, jobs and outlook
BLS lists a postsecondary nondegree award as the typical entry-level education for LPNs and a bachelor's degree for RNs, with no work experience in a related occupation required for either. Read together with the pay figures, the LPN route asks for a shorter program and the RN route for a longer degree. This site's guide to how long nursing school takes covers the time involved, and the LPN salary guide has the LPN percentile and industry detail in one place.
BLS projects RN employment to grow 6% from 2025 to 2035, adding about 194,700 jobs, and LPN employment to grow 3%, adding about 19,700 jobs. The RN figure is roughly ten times the LPN figure in jobs added, and the RN workforce starts about five times larger. For two higher-paid nursing roles that BLS reports separately, see the nurse practitioner salary and CRNA salary pages.