What BLS recorded, year by year
The question has a published answer, and it is not one number. In February 2018 the Bureau of Labor Statistics devoted a Monthly Labor Review article to injuries and illnesses among line installers and repairers, covering 2011 through 2015. The analysis draws on two separate BLS systems: the Census of Fatal Occupational Injuries, which is a complete count built from death certificates, workers compensation records and reports to federal and state agencies, and the Survey of Occupational Injuries and Illnesses, which estimates nonfatal cases requiring at least one day away from work from what employers report.
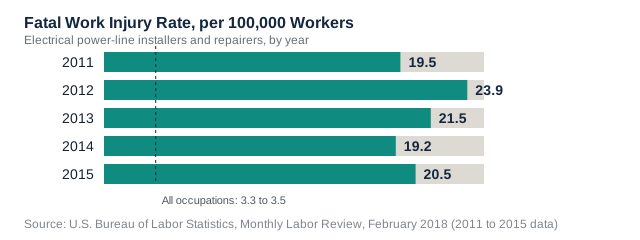
BLS found that electrical power-line installers and repairers appeared on the agency's annual list of the civilian occupations with high fatal work injury rates in every one of those five years. The agency states the list plainly: "Each year, BLS lists 10 civilian occupations with high fatal-work-injury rates." Their fatal work injury rate per 100,000 full-time equivalent workers was 19.5 in 2011, 23.9 in 2012, 21.5 in 2013, 19.2 in 2014 and 20.5 in 2015. Across the same years the rate for all workers combined ranged from 3.3 to 3.5. In every one of the five years the trade's rate was more than five times the all-worker figure.
In counts rather than rates, the occupation recorded 131 fatal work injuries over the five years. BLS tracks the telecommunications line trade separately under a different code, and adding it brought the two line installer occupations to 201 deaths, close to 40 a year. The agency notes that the annual count for the power-line side stayed fairly steady, while the telecommunications side ranged from 10 deaths in 2012 to 19 in 2014. That window is also where the detail stops. The bureau's 2024 fatality release reports the year by broad occupational group rather than by individual occupation, and this page could not verify a newer occupation-level rate series for the trade than the 2011 to 2015 one.
The two line trades next to everyone else
Because BLS collected all of this in the same release, the trade can be placed next to its nearest relative and to the workforce as a whole on identical measures. Every figure in the table below is one the agency published; none is recalculated.
| Measure | Electrical power-line installers | Telecommunications line installers | All occupations |
|---|---|---|---|
| Fatal work injury rate, per 100,000 full-time equivalent workers, all ownerships (2011 to 2015) | 19.5, 23.9, 21.5, 19.2, 20.5 | 7.9 in 2013 and 10.0 in 2014, the only years that analysis reports a rate for | 3.3 to 3.5 |
| Nonfatal injury and illness rate, per 10,000 full-time equivalent workers, private industry (2011 to 2015) | 211.3, 167.5, 202.9, 182.2, 173.9 | 217.2, 227.5, 386.9, 350.1, 411.3 | 104.3, 101.9, 99.9, 97.8, 93.9 |
| Median days away from work, private industry, 2015 | 20 | 42 | 8 |
| Cases lasting 31 or more days, share of total, private industry, 2015 | 44.3% | 55.3% | 28.6% |
The pattern is not the same on every measure. For fatal injuries the power-line trade sits well above both comparison groups. Nonfatal injury and illness rates tell a different story: the two line trades started close together and then diverged, with the telecommunications side climbing to 386.9 per 10,000 workers in 2013 while the power-line side was 202.9 that same year. On how long an injury keeps someone off the job, the telecommunications trade is the harsher of the two, at a median of 42 days, where the power-line median was 20.
The same 2015 table reports how much of the harm was serious. Just under 29% of all occupational injury cases lasted 31 days or more, against 44.3% of cases in the power-line trade and 55.3% in the telecommunications trade.
Live wires, the road, and falls
The bureau summary of the work itself is direct: electrical power-line installers and repairers "encounter serious hazards on the job, including working with high-voltage electricity, often at great heights." Exposure to electricity is the leading cause of death in this occupation. It accounted for 62 of the 131 deaths between 2011 and 2015, close to half, while causing only 3% of fatal work injuries across all occupations in the same period. On the telecommunications side the same exposure caused 13 of 70 deaths.
Transportation incidents are the second leading cause, with 58 deaths across the two trades. That is about 30% of the power-line deaths and 27% of the telecommunications deaths, both below the 41% share such incidents represent among all workers who died. Within the group, 20 deaths involved a roadway collision with a second vehicle, 33 of the workers killed were driving and 9 were passengers.
Falls come third. Across the two line installer trades, 43 workers died in falls to a lower level. Ladders account for 35% of those falls and towers or poles for another 33%. More than two-fifths of the line installer fatal falls were from 30 feet or higher, compared with about one-fifth of fatal falls for occupations overall.
The 72 fatal electrocutions recorded across both line installer occupations amount to one-tenth of every fatal electrocution counted among US workers in those five years.
Why the figures in circulation do not line up
The figures that circulate for this question are single years, and they come from different vintages. A blog on the site of R&R Lotion, a skincare brand, states that electrical power-line installers and repairers have a fatality rate of 20.3 per 100,000 full-time workers and cites 2019, when it says the occupation recorded 29 fatal injuries. A page published by Bailey, Javins and Carter, a personal injury firm, gives approximately 21 lineman deaths per 100,000 workers, without naming a year or pointing to the underlying figure. A 2021 feature in Claims Journal, an insurance trade publication, works from 2018 data, when it reports 29 deaths and a fatal injury rate of 19.3 per 100,000, set against 14 for police officers and 13 for construction workers that year.
None of those figures is necessarily wrong. The differences appear to come from which year each one picked, at least where a year is stated, and a single year is a thin basis for a question about risk, because annual death counts for one occupation are small enough to swing.
The Google AI Overview shown for this query when it was checked on 2026-10-15 takes the widest approach, stating that the fatality rate for lineworkers is nearly 400% higher than the national average and putting deaths at about 26 to 42 a year. It also states that linemen face a non-fatal injury rate of 104.6 per 10,000 full-time workers. That last figure does not match what BLS published for this occupation. The nonfatal injury and illness rate for electrical power-line installers ranged from 167.5 to 211.3 per 10,000 workers across those five years, and 104.3 was BLS's figure for all occupations combined in 2011. BLS publishes the underlying figures in full, so the series is the version to check a summary against.
For completeness on the pay side, BLS puts the median annual wage for electrical power-line installers and repairers at $95,320 in May 2025, with the lowest 10% earning under $51,470 and the highest 10% earning over $128,690. Those numbers come from the Occupational Employment and Wage Statistics survey, a third BLS program separate from both injury systems, and they carry no information about risk.
For the route into the trade, this site's guide to becoming a lineman sets out the apprenticeship requirements and the commercial license step. Electrician pay covers a related trade in the same broad family, and firefighter pay covers another occupation this site tracks with its own BLS wage, outlook and employment figures.
Trades cluster: lineman risk, electrician and welder pay
May 2025 medians: linemen $95,320, electricians $63,190, welders $53,750. Route: how to become a lineman; welding hazards: is welding dangerous.