U.S. salary & occupation data · BLS sourced Ser. 2026

Salary Guide SOC 29-2034

Radiology Tech Salary: BLS Wage Data by Percentile (2026)

BLS puts the median radiology tech salary at $77,660 a year. See the full wage range by percentile, by industry, and how the role differs from MRI techs.

Last updated 2026-08-21 · Wage data: May 2024 (BLS)

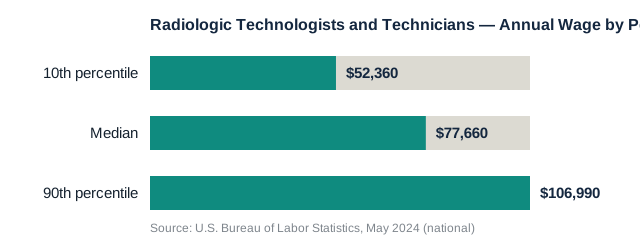
Bar chart showing radiologic technologist annual wage by percentile: 10th percentile $52,360, median $77,660, 90th percentile $106,990, based on BLS May 2024 data.

Key figures

The median annual wage for radiologic technologists and technicians was $77,660 in May 2024, according to the U.S. Bureau of Labor Statistics. The bottom 10% earned less than $52,360 while the top 10% earned more than $106,990, and the highest-paying employer category was the federal government, at a median of $93,970.

Radiologic Technologists and Technicians: Annual Wage by Percentile (May 2024, U.S. national)

10th percentile
$52,360
Median
$77,660
90th percentile
$106,990

Source: BLS Occupational Outlook Handbook: Radiologic and MRI Technologists, May 2024.

Tool

See where your salary stands

Enter your own pay as a radiologic technologists and technicians, either annual or hourly, and this tool locates it against the BLS wage percentiles above.

Pay basis

BLS does not publish a separate hourly median for this occupation, so hourly figures here are the annual figure divided by 2,080 hours/year (BLS full-time convention).

Calculated client-side from BLS Occupational Outlook Handbook: Radiologic and MRI Technologists, May 2024. Not personalized career, financial, or tax advice.

Radiologic Technologists and Technicians: Annual Median Wage by State (May 2025, BLS state estimates)

The national median above blends every state into one number. BLS also publishes radiologic technologists and technicians pay by state, and the 51 figures below can differ from that national median by tens of thousands of dollars depending on where you work. This is a separate BLS dataset (state OEWS estimates), not a breakdown of the national percentiles above it.

State10th percentileMedian90th percentile
California$70,210$121,260$165,460
Massachusetts$75,350$103,620$131,940
District of Columbia$59,130$102,770$128,120
Oregon$70,760$102,290$124,810
Washington$66,570$102,090$132,060
Hawaii$39,150$101,700$115,440
Alaska$74,210$98,920$126,860
New York$67,540$98,470$129,310
New Jersey$71,770$95,000$118,410
Vermont$66,960$94,540$125,230
Connecticut$68,070$91,970$122,760
Arizona$61,510$89,200$123,410
Colorado$63,270$87,760$111,730
Maryland$68,140$85,890$106,260
Rhode Island$65,840$85,330$109,640
New Hampshire$64,620$84,910$106,370
Delaware$61,770$84,210$108,980
Minnesota$67,080$83,400$106,100
Nevada$65,710$82,910$121,700
Utah$48,150$81,000$108,070
Virginia$60,000$80,670$106,170
Idaho$60,540$80,080$103,580
Maine$62,210$80,080$102,640
New Mexico$59,560$79,940$104,120
Illinois$59,350$79,930$104,210
Wisconsin$61,870$79,140$99,420
Texas$48,550$78,630$102,630
Ohio$60,360$78,320$98,450
Wyoming$56,750$77,860$104,790
Indiana$51,090$77,640$99,580
Montana$55,750$77,070$91,650
Florida$51,390$76,750$99,020
Michigan$55,450$76,420$97,250
Kansas$50,940$76,070$98,320
Pennsylvania$56,430$76,050$97,740
Georgia$49,730$74,550$102,840
North Carolina$52,860$74,450$99,210
Oklahoma$49,920$74,160$96,880
West Virginia$56,270$74,150$95,510
Missouri$50,810$73,080$97,150
Nebraska$54,410$72,860$98,300
Kentucky$51,740$69,670$99,170
South Carolina$51,860$69,600$96,020
North Dakota$60,600$67,790$93,870
Iowa$54,360$65,930$86,520
South Dakota$48,730$65,240$89,710
Tennessee$50,540$64,630$90,790
Louisiana$50,030$63,680$82,830
Arkansas$46,810$63,640$94,180
Alabama$41,060$60,700$80,300
Mississippi$40,740$59,300$78,090

Source: BLS Occupational Employment and Wage Statistics, state estimates, May 2025. If your state is missing, BLS did not publish a wage estimate for this occupation there that year; it does not mean the wage was zero.

Industry (May 2024) Median annual wage
Federal government (excl. postal service) $93,970
Outpatient care centers $81,000
Hospitals (state, local, private) $78,560
Medical and diagnostic laboratories $76,770
Offices of physicians $66,060

Jobs (2024)

228,000

Outlook (2024-34)

4%

Employment change

+9,800

Typical entry education

Associate's degree

What "radiology tech" actually means, and what the role pays

The Bureau of Labor Statistics tracks this job under the title "Radiologic Technologists and Technicians," SOC code 29-2034, which is the role most people mean when they search "radiology tech": the person who positions patients and operates x-ray and CT equipment. It is a distinct occupation from Magnetic Resonance Imaging (MRI) technologists, who work with different equipment and are tracked separately by BLS under SOC code 29-2035 (median annual wage $95,480 in May 2025, the more recent figure this site's MRI technologist salary guide covers in full), and from radiologists, who are physicians who interpret the images rather than technicians who capture them. Job postings sometimes use these titles loosely, so the wage figure that applies depends on which specific role is being described.

For radiologic technologists and technicians specifically, BLS reported a median annual wage of $77,660 in May 2024. The bottom 10% of earners made less than $52,360 a year, while the top 10% made more than $106,990, a spread of roughly $54,600. That range reflects a mix of experience, credential level (a base radiography certification versus additional specialty certifications in CT or mammography), employer type, and region, rather than any single factor. This page's Quick Facts box lists a combined hourly figure of $37.97 for the broader "Radiologic and MRI Technologists" grouping (which blends this occupation with the higher-paying MRI technologist role), not a figure specific to radiologic technologists and technicians alone, so it is left out of the numbers above to avoid overstating typical hourly pay for this occupation.

BLS figures are national medians drawn from its Occupational Employment and Wage Statistics survey, which collects data directly from employers rather than relying on self-reported salary submissions the way some job-search sites do. That distinction matters when comparing this page to other sources: a site built on self-reported figures can skew toward workers motivated to report unusually high or low pay, while employer-reported OEWS data reflects actual payroll records across a much larger, more representative sample. BLS does not publish a state-by-state breakdown on this specific page; readers who need per-state or per-metro figures would need the BLS OEWS state wage tables directly, which break the same occupation down by geography.

Why the employer you work for changes the number

BLS breaks out May 2024 wages by industry, and the differences are large enough to matter when comparing job offers. Federal government employment (excluding the postal service) paid the highest median at $93,970, followed by outpatient care centers at $81,000 and hospitals at $78,560. Medical and diagnostic laboratories paid a median of $76,770, and offices of physicians, often smaller practices with less imaging volume, paid the least of the five categories BLS reports, at $66,060.

The roughly $28,000 gap between the top and bottom industry categories is wider than the typical spread for allied health roles, and it runs somewhat counter to the assumption that hospital settings pay the most. BLS does not explain why federal employment ranks highest for this specific role; it publishes the wage-by-industry figures without an accompanying explanation. One plausible, unverified factor is that federal employers such as the VA and military treatment facilities generally use standardized General Schedule pay scales rather than the market-rate-by-metro pricing common in private hospitals and physician offices, but that is this article's inference, not a claim BLS itself makes.

These five categories are the industries BLS separately tracks wages for in this occupation on the Occupational Outlook Handbook page; they do not cover every possible employer type, and this page reports wages by industry without also breaking out how many radiologic technologists work in each one. Readers who want a headcount-by-industry breakdown, rather than a wage-by-industry breakdown, would need the BLS OEWS industry tables directly, which is a separate data product from the Handbook page cited here.

Licensing and how techs enter the field

Entry-level education for this role is an associate's degree, per BLS, typically from an accredited radiography program that combines classroom instruction with supervised clinical hours. BLS states that most states require radiologic technologists to be licensed or certified, with requirements varying by state, and that the standard path is completing an accredited program and then either passing a state exam or earning certification from a credentialing organization. BLS does not name a specific credentialing body on this page; the American Registry of Radiologic Technologists (ARRT), which administers the field's primary Radiography (R) credential, is a separately confirmed, real credentialing organization, not a BLS-sourced detail.

This credential-gated structure is part of why pay does not simply track years of experience: a tech who adds a specialty certification in computed tomography (CT) or mammography on top of a base radiography credential typically qualifies for higher-paying assignments, since additional certifications expand which equipment and procedures the tech is authorized to operate, though BLS itself does not quantify this effect. For readers comparing adjacent diagnostic-imaging careers, ultrasound technologists follow a similarly structured associate-degree-plus-certification path, though sonography uses different equipment and is credentialed through a separate, independently confirmed organization, the American Registry for Diagnostic Medical Sonography (ARDMS).

Accredited radiography programs generally run about two years at the associate-degree level, combining classroom coursework in anatomy, patient positioning, radiation physics, and safety with supervised clinical hours in an imaging department. That two-year timeframe reflects the standard length of an associate degree generally, not a figure stated on the BLS page or documented in a specific program-duration source; the Joint Review Committee on Education in Radiologic Technology (JRCERT), the field's program-accreditation body, publishes accreditation award terms (how long a program's accreditation itself stays valid), which is a different thing from how long the program takes a student to complete. This is a formally licensed or certified occupation in most states, not a role someone can be trained into purely on the job, which is why BLS lists "none" for additional on-the-job training beyond the associate degree and clinical training already built into an accredited program.

Job outlook and how this compares to other allied health pay

BLS projects 4% employment growth for radiologic technologists and technicians from 2024 to 2034, faster than the roughly 3% average projected across all occupations, adding an estimated 9,800 jobs over the decade. The broader category that includes MRI technologists is projected to grow faster still, at 5%, with about 15,400 combined openings expected each year on average, reflecting continued demand for diagnostic imaging tied to an aging population and rising rates of chronic disease.

For context on where this occupation sits within allied health pay generally, another growing licensed field, physical therapy, carries a median annual wage of $101,020, roughly $23,000 above radiologic technology. The gap largely tracks entry education: physical therapy requires a doctoral degree (DPT), while radiologic technology requires only an associate's degree and a shorter, less expensive path to a first paycheck. Neither figure predicts what a specific person will earn; both describe national medians for occupations with real variation by state, employer, and specialty certification. This site's surgical tech salary guide covers BLS wage data and job outlook for another allied health role. At the opposite end of that allied-health-to-physician pay spectrum, psychiatrists post a $281,870 BLS median, the product of a medical-school-and-residency path several multiples longer than this occupation's associate degree.

BLS attributes projected growth in this occupation mainly to demographic trends: an aging population that needs more diagnostic imaging for conditions like falls, fractures, and chronic disease, combined with continued reliance on x-ray and CT imaging as a first-line diagnostic tool across emergency medicine, orthopedics, and primary care. That is a demand-side projection about the healthcare system as a whole, not a forecast about any individual technologist's job security, employer, or pay trajectory, and readers evaluating a specific offer should weigh it alongside local job market conditions rather than as a standalone guarantee.

Frequently asked questions

What is the average radiology tech salary?

According to the U.S. Bureau of Labor Statistics, the median annual wage for radiologic technologists and technicians was $77,660 in May 2024. "Median" means half of workers in the role earned more and half earned less. BLS does not publish a separate median hourly wage for this specific occupation on this page; the $37.97 hourly figure shown in the page's Quick Facts box covers a broader, combined "Radiologic and MRI Technologists" grouping, not radiologic technologists alone.

What is the highest-paying setting for a radiology tech?

Among the industry categories BLS tracks for May 2024, federal government employment (excluding the postal service) paid the highest median at $93,970, ahead of outpatient care centers ($81,000), hospitals ($78,560), medical and diagnostic laboratories ($76,770), and offices of physicians ($66,060).

How much do the lowest- and highest-paid radiology techs make?

BLS reports that the bottom 10% of radiologic technologists and technicians earned less than $52,360 a year in May 2024, while the top 10% earned more than $106,990. Additional specialty certifications, such as CT or mammography on top of a base radiography credential, are one plausible factor separating higher earners within the field, though BLS itself does not quantify this.

Do radiology techs need to be certified?

BLS states that most states require radiologic technologists to be licensed or certified, though requirements vary by state, via completing an accredited program and then passing a state exam or earning certification from a credentialing organization. The American Registry of Radiologic Technologists (ARRT) is the field's primary credentialing body in practice, confirmed independently of the BLS page (see Sources).

Is radiologic technology a growing field?

BLS projects 4% employment growth for radiologic technologists and technicians from 2024 to 2034, faster than the roughly 3% average projected across all occupations, adding an estimated 9,800 jobs over the decade.

What year is the BLS OEWS data on this page from?

This guide cites the U.S. Bureau of Labor Statistics Occupational Outlook Handbook page for radiologic and MRI technologists, which draws on Occupational Employment and Wage Statistics (OEWS) data from May 2024, the most recent year BLS had published as of this guide's last update. BLS's OEWS program also tracks total nationwide employment for the occupation, but this page reports the median wage, percentile spread, and projected job growth figures above rather than a separate current employment headcount.

How long does it take to become a radiology tech?

BLS lists an associate's degree as the typical entry-level education for radiologic technologists, a credential that generally takes about two years of full-time study, combining coursework in anatomy, radiation physics, and patient care with supervised clinical hours. BLS does not itself state an exact number of years on this page; two years reflects the standard length of an associate degree generally, the same convention this site uses for other associate-degree occupations such as diagnostic medical sonography.

Which pays more, an RN or a radiology tech?

Registered nurses earned more in May 2024: a median of $93,600, per BLS data cited on this site's how long is nursing school guide, compared with $77,660 for radiologic technologists and technicians the same year. Both figures come from BLS's Occupational Employment and Wage Statistics survey, though the two occupations sit on separate Handbook pages with different typical entry-level education: a bachelor's, associate's, or diploma path for RNs versus an associate's degree for radiologic technologists.

Is becoming a radiology tech hard?

The credentialing exam is passable but not a formality. ARRT's 2025 Annual Exam Report puts the first-time pass rate for the Radiography exam at 86%, with Image Acquisition and Technical Evaluation, and Equipment Operation and Quality Assurance, the two content areas candidates struggle with most. That's on top of an accredited two-year associate degree program with supervised clinical hours, so the harder part for most students is finishing the program itself, not the exam at the end of it.

What type of radiology tech makes the most money?

BLS tracks base radiologic technologists and technicians separately from more specialized imaging roles, and the specialized roles pay more. MRI technologists, who need an additional certification on top of the base radiography credential, posted a $95,480 BLS median in May 2025, about $18,000 above the base radiologic technologist figure this page covers. Techs who add other specialty certifications, such as CT or mammography (the latter federally regulated under the Mammography Quality Standards Act, with its own required training hours), typically qualify for higher-paying assignments too, though BLS does not publish separate median wages for every specialty certification.

Cite this

WageLark Editorial, “Radiology Tech Salary: BLS Wage Data by Percentile (2026),” WageLark, published August 4, 2026, https://wagelark.com/radiology-tech-salary/.

This page reports government wage statistics for informational purposes. It is not personalized career, financial, or legal advice, and does not endorse or recommend any specific employer, school, or training program.

Response card

Did these figures answer your question?

Written and edited by the WageLark Editorial Team