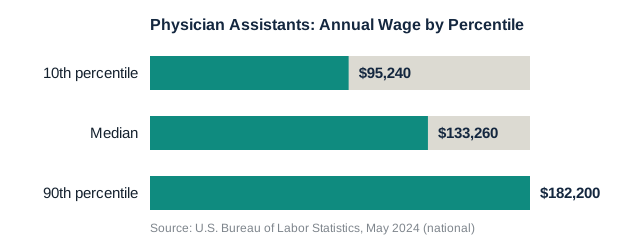
What physician assistants earn, by percentile
The Bureau of Labor Statistics tracks physician assistant pay under SOC code 29-1071 through its Occupational Employment and Wage Statistics (OEWS) program, which draws on employer payroll reports rather than self-submitted figures. The most recent published data, from May 2024, put the median annual wage at $133,260, or $64.07 an hour.
That median sits inside a fairly wide range. The bottom 10% of physician assistants earned less than $95,240 a year, while the top 10% earned more than $182,200, a spread of roughly $87,000. Unlike some occupations on this site where BLS only publishes a percentile range for a combined group of related roles, this page reports a range specific to physician assistants alone, since BLS breaks this occupation out individually.
For what the job itself actually involves day to day, rather than what it pays, see this site's guide to what a physician assistant does, which covers duties, specialties, and the education path in more detail than this page does.
Why this figure can look different on other salary sites
Readers comparing this $133,260 median against a number seen elsewhere should check what that other figure actually measures. BLS wage data comes from its Occupational Employment and Wage Statistics survey, which collects reports directly from employer payroll records across a large national sample. Job-search and salary-aggregator sites often rely instead on figures self-reported by a smaller, self-selected pool of users, or on internal listings data, a collection method that can run noticeably higher or lower than the employer-reported BLS median depending on the site, the time period, and how recently it was updated.
Neither approach is inherently wrong, but they answer slightly different questions. BLS describes what physician assistants nationally were actually paid, on employer records, as of May 2024. A self-reported aggregator describes what a subset of site visitors chose to report, at whatever moment the site last refreshed its figures, which can shift from month to month. For a figure meant to hold steady as a reference point, this page uses the BLS number specifically because of that employer-record methodology.
Why the employer you work for changes the number
BLS breaks out May 2024 wages by industry, and the gap between the highest- and lowest-paying categories is large enough to matter when comparing offers. Government employment (excluding state and local education and hospitals) paid the highest median, at $151,470, followed by outpatient care centers at $147,650 and hospitals (state, local, and private) at $136,630. Offices of physicians, the setting many people associate most closely with the role, paid a median of $129,640, close to but still below the national median. Educational services paid the least of the five categories BLS tracks, at $127,900.
That ordering runs somewhat counter to a common assumption that private physician practices pay the most. One plausible factor, which BLS does not explain on this page, is that government and outpatient-center employers often serve higher patient volumes or operate under standardized pay scales that set a wage floor above what a smaller private practice can offer per provider. That is this article's inference, not a claim BLS itself makes.
How PA pay compares to nearby advanced-practice and clinical roles
Physician assistant pay sits in the middle of a cluster of graduate-trained clinical roles this site tracks. Nurse practitioners, a role BLS reports separately, had a lower May 2024 median of $129,210, despite both occupations typically requiring a master's degree for entry. Pharmacists, who require a doctoral degree (PharmD), had a somewhat higher median of $140,910. Certified Registered Nurse Anesthetists, who now require a doctoral degree for new entrants, had a median of $223,210, well above all three of the other roles.
The pattern across these four occupations is not a clean line from "more required education" to "more pay": physician assistants and nurse practitioners both typically enter with a master's degree, yet PA pay is meaningfully higher, and pharmacists require a doctorate but earn less than CRNAs by a wide margin. Setting, procedure mix, and the maturity of each field's independent-practice authority likely all play a role, though BLS does not publish a study explaining the specific gap between any two of these occupations, so readers should treat this comparison as descriptive rather than a mechanism BLS has confirmed.
How much clinical autonomy a PA has also varies by state, in the same way it does for nurse practitioners. This site's career guide notes that a PA's scope of practice depends on both state law and the supervising physician's practice agreement, and that this has been an active area of state-level legislative change in recent years. Wage data does not capture that variation directly, but broader autonomy in a given state can plausibly affect what a practice is willing to pay, alongside the setting and industry factors covered above.
Job outlook and what it means for pay
BLS projects 20% employment growth for physician assistants from 2024 to 2034, classified as much faster than average against an all-occupation baseline of roughly 3%, adding an estimated 33,200 jobs to a base of 162,700. That is a faster projected growth rate than pharmacists (5%) or CRNAs (9%), though slower than nurse practitioners (40%), the fastest-growing role in this cluster.
BLS attributes projected PA growth mainly to the broader demand drivers common across advanced-practice clinical roles: an aging population needing more healthcare services, rising rates of chronic disease, and continued expansion of team-based care models that use PAs and nurse practitioners to extend physician capacity. Faster-than-average growth in a licensed, credential-gated occupation tends to support wage growth over time, since programs cannot expand the supply of qualified graduates as quickly as demand can rise, though BLS does not publish a forecast for future wage levels, only employment counts.
Entry to the field requires a master's degree from an accredited PA program and passing the national certifying exam; this site's career guide covers that path, along with the day-to-day duties and specialty mix, in full.
What this national figure does not cover
The $133,260 median is a single national number, not a state or metro-area figure. PA pay varies by region for reasons common to most licensed professions: local cost of living, the concentration of hospital systems and outpatient networks, and regional supply of PA-program graduates relative to open positions. BLS publishes more granular state and metropolitan-area wage tables for individual occupations through its separate Occupational Employment and Wage Statistics program, outside the Occupational Outlook Handbook page this article draws from; readers who need a figure for a specific state or city should consult that more detailed data set rather than assume the national median applies evenly everywhere.