How much more than the typical worker?
BLS files this work under the title software developers, SOC code 15-1252. Its May 2025 median annual wage was $135,980. The median across all U.S. occupations in the same survey was $50,980, so the typical software developer earned about 2.7 times the typical worker. Against the broader computer occupations group, whose median was $109,470, the developer figure is about 24% higher.
The occupation boundary matters when reading that number. The BLS Handbook page that carries 15-1252 also carries a second code, software quality assurance analysts and testers (15-1253), whose May 2025 median was $104,300. The page's Quick Facts box shows one combined figure for both codes, $134,040 a year and $64.44 an hour. The $135,980 median is the developer-only figure from the Pay section, and the page carries no developer-only hourly figure.
The page splits the two codes on employment as well: software developers held about 1,717,800 jobs in 2025 and the QA analysts and testers about 187,600, out of roughly 1,905,400 for the combined group.
A posting titled software engineer and one titled software developer usually describe the same occupation. O*NET, the Labor Department's job-title database, lists Software Engineer among the sample reported job titles filed under 15-1252.00, next to Software Architect, Application Developer, and DevOps Engineer.
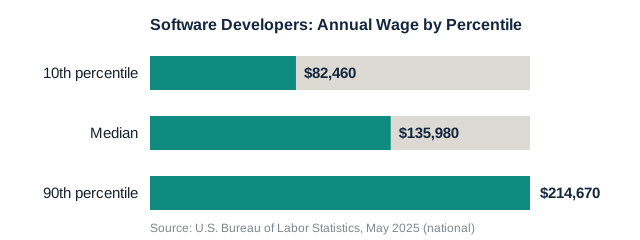
The pay range above and below the median
BLS reports the ends of the distribution along with the midpoint. The lowest-paid 10% of software developers earned less than $82,460 in May 2025, and the highest-paid 10% earned more than $214,670. The gap between those two published boundaries is $132,210, and the top boundary is about 2.6 times the bottom one.
The bottom boundary sits well above the national midpoint. At $82,460, the 10th-percentile developer wage is about 1.6 times the $50,980 median for all occupations, so the lowest-paid tenth of developers still out-earns the typical US worker by a wide margin. On this occupation the low end of the pay scale is not close to the low end of the labor market.
The published spread is wide enough that the middle of the occupation sits closer to the bottom boundary than to the top: the median is $53,520 above the 10th-percentile line and $78,690 below the 90th.
BLS does not break developer pay out by years of experience, company size, or job title inside the code. The percentile range is the official picture of how pay spreads across the occupation, and it is the only spread BLS publishes for it.
The industries that pay most, and the one that hires most
BLS lists median pay for five industries. Software publishers, the firms whose product is the software itself, paid the highest at $164,550. Manufacturing followed at $136,330, management of companies and enterprises at $135,680, and finance and insurance at $135,460. Computer systems design and related services paid the lowest of the five, at $132,050. The spread between the top and bottom of that list is $32,500, or about 25%.
The employer counts run the other way. Computer systems design and related services employs about 29% of software developers, finance and insurance 11%, software publishers 10%, manufacturing 8%, and management of companies and enterprises 6%. The industry that pays the least of the five is also the one that employs the most developers, by roughly 2.6 to one over the next largest.
BLS publishes the pay levels and the employment shares as separate lists and does not connect them. The pairing describes where the jobs sit and where the money sits; it does not establish that working in one industry rather than another causes the difference in median pay.
What the wage figures leave out
These numbers come from the Occupational Employment and Wage Statistics program, which surveys employers. Its published definitions count production bonuses in the wage total and exclude stock bonuses, non-production bonuses, and overtime pay. That distinction matters in a field where some large employers pay a substantial share of compensation in equity, because none of that equity appears in the $135,980 median or anywhere else on the BLS page. Self-employed workers fall outside this survey altogether, and in some occupations they are the bulk of the field; the farm manager pay breakdown sets out what BLS can and cannot say when 67% of the workers own the business.
The $214,670 figure is the highest boundary BLS publishes for this occupation. It is a floor for the top decile, not a ceiling. BLS reports that the top 10% earned more than that amount and does not say by how much, so the series cannot confirm or rule out any specific figure above it.
The combined developer and QA figure carries the only hourly wage on the page, $64.44. Applying that rate to developers alone would produce a number BLS does not publish, so this page reports only the annual figures BLS breaks out by occupation.
Does the data explain why?
The figures above measure how pay is distributed. They do not identify why it sits where it does, and BLS publishes no causal figure for the gap.
One piece of research points at a mechanism. A paper posted to the Federal Reserve Bank of San Francisco's EmergingTech Economic Research Network in April 2025 by Jacob Herbstman, Jack Mannion, and Gustavo De Souza studies a new dataset of Brazilian programmers. It finds that high-ability, high-wage, and highly educated people in key technology hubs are more likely to become programmers in the first place, and that the wage gains from creating software are concentrated among top programmers. The sample is Brazilian, so the paper's magnitudes are not a US pay premium, and it does not put a figure on how much of the US gap comes from selection into the profession as opposed to demand for it.
That leaves the common explanation, that demand for software skills outpaces supply, as a plausible mechanism these sources do not measure. What BLS establishes is the size and shape of the gap. What it does not establish is how much of the gap any single cause accounts for.
How the developer figure compares with other occupations on this site
Against other occupations this site tracks, $135,980 puts software developers near the top of the fields whose BLS profile names no license or standardized exam. Actuaries had a median of $130,000 and accountants $83,680, though both of those figures come from the May 2025 survey (see actuary salary and how to become an accountant).
For the entry path itself, the degree and licensing picture sits on this site's guide to becoming a software engineer, which covers what BLS says about the bachelor's degree and the absence of a license requirement.